Motion Graphics
Frame-by-frame graphics designed to be animated — handed off to video editors as ready-to-move scenes for explainers and data stories.
Storyboard Frames · Infographics · Illustration · Hand-off for Animation
The Story
I work with video editors to design the static frames that become animated explainers — every shape, label, and beat planned so the editor can pick it up and move it without rebuilding anything.
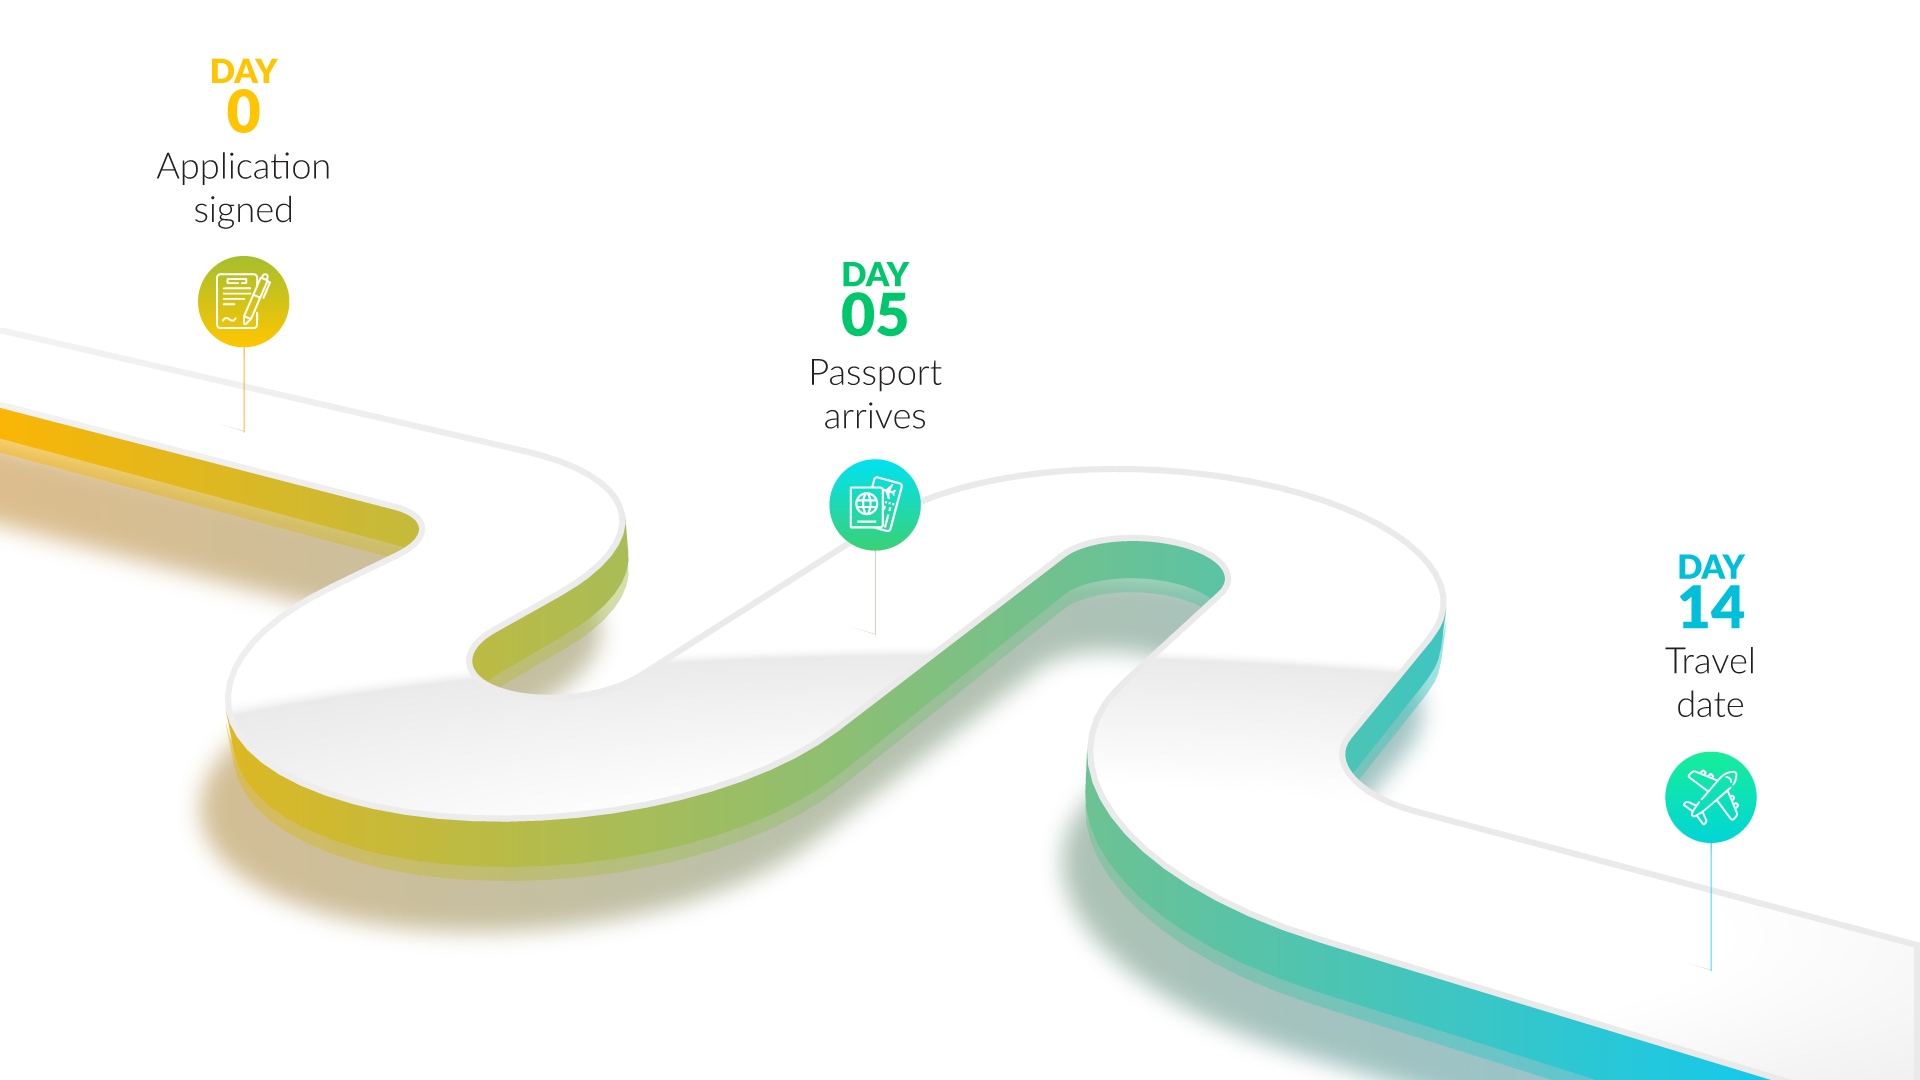
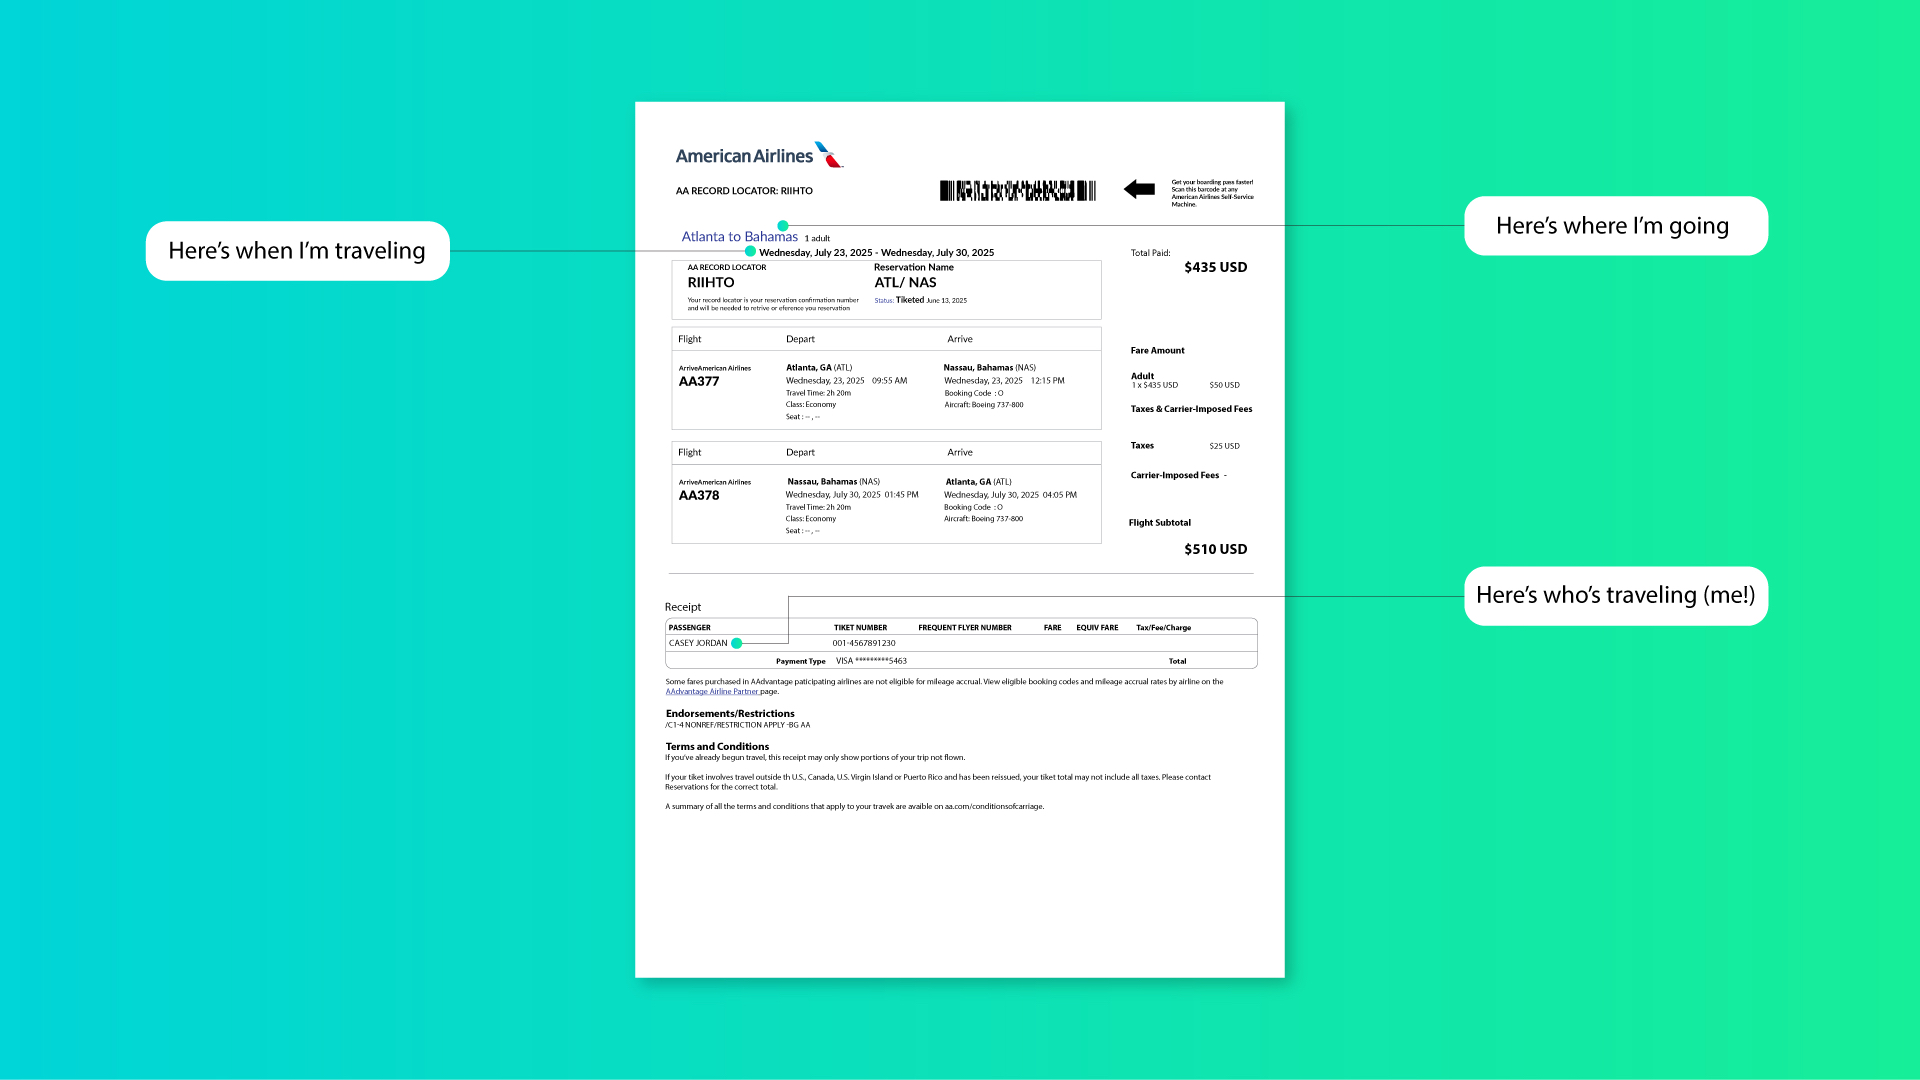
Two projects shown here. The first is a travel/passport explainer: a 3D winding road that walks the viewer from Day 0 (application signed) to Day 14 (travel date), a progress bar with milestone icons, and annotated booking-confirmation frames that tell the story of a trip that's almost paid for.
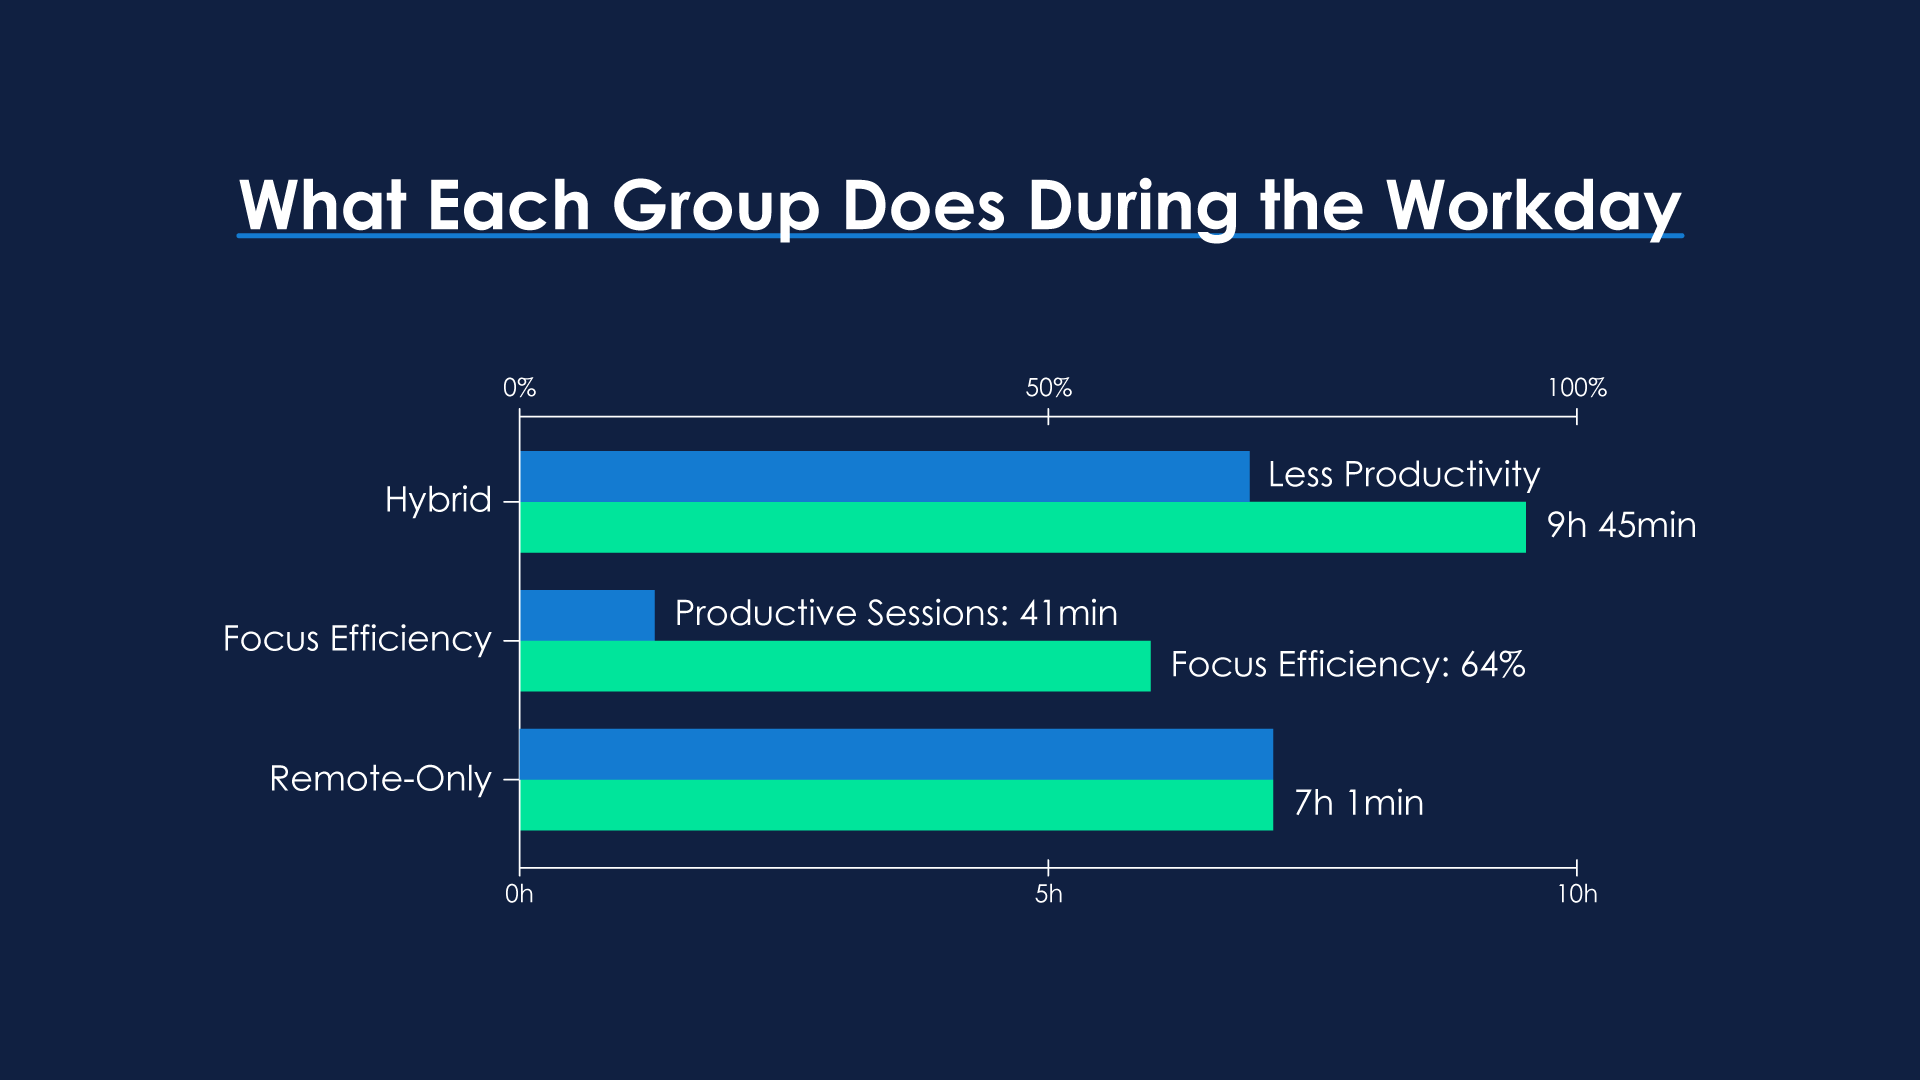
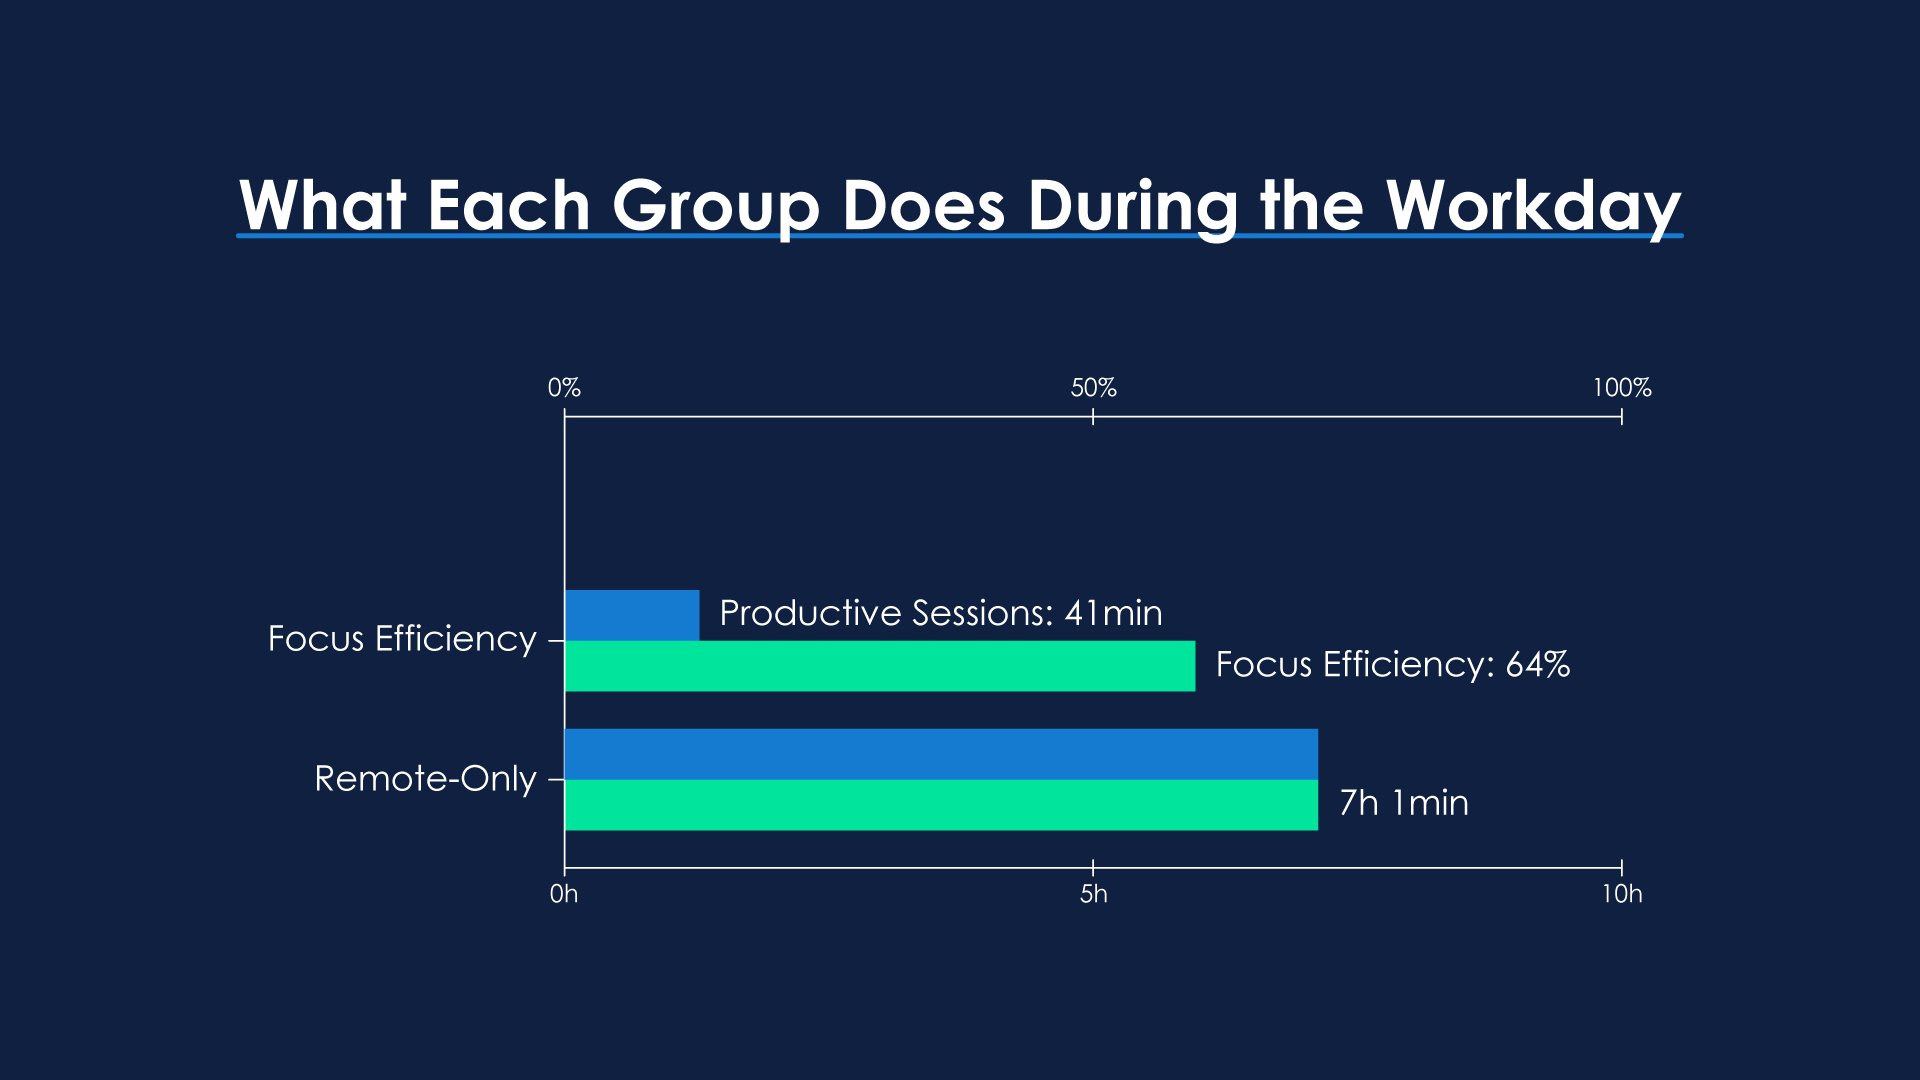
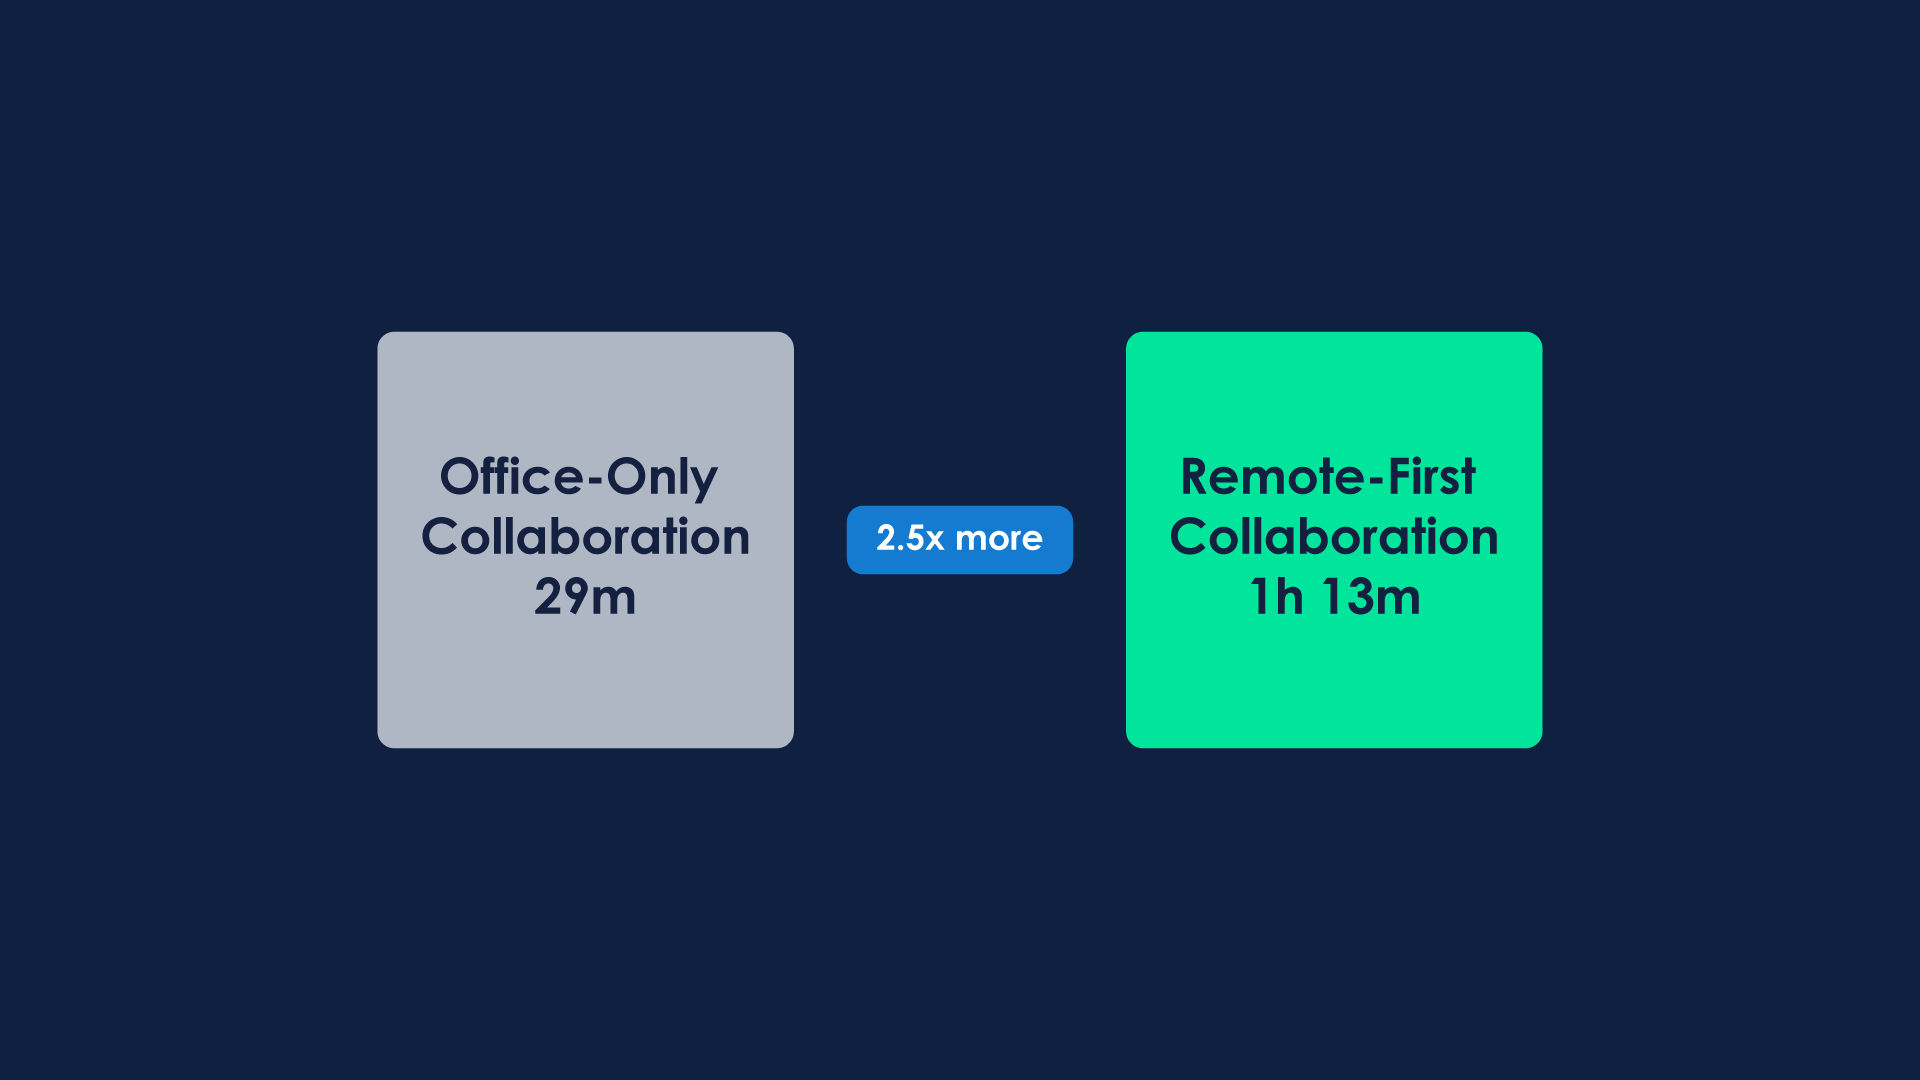
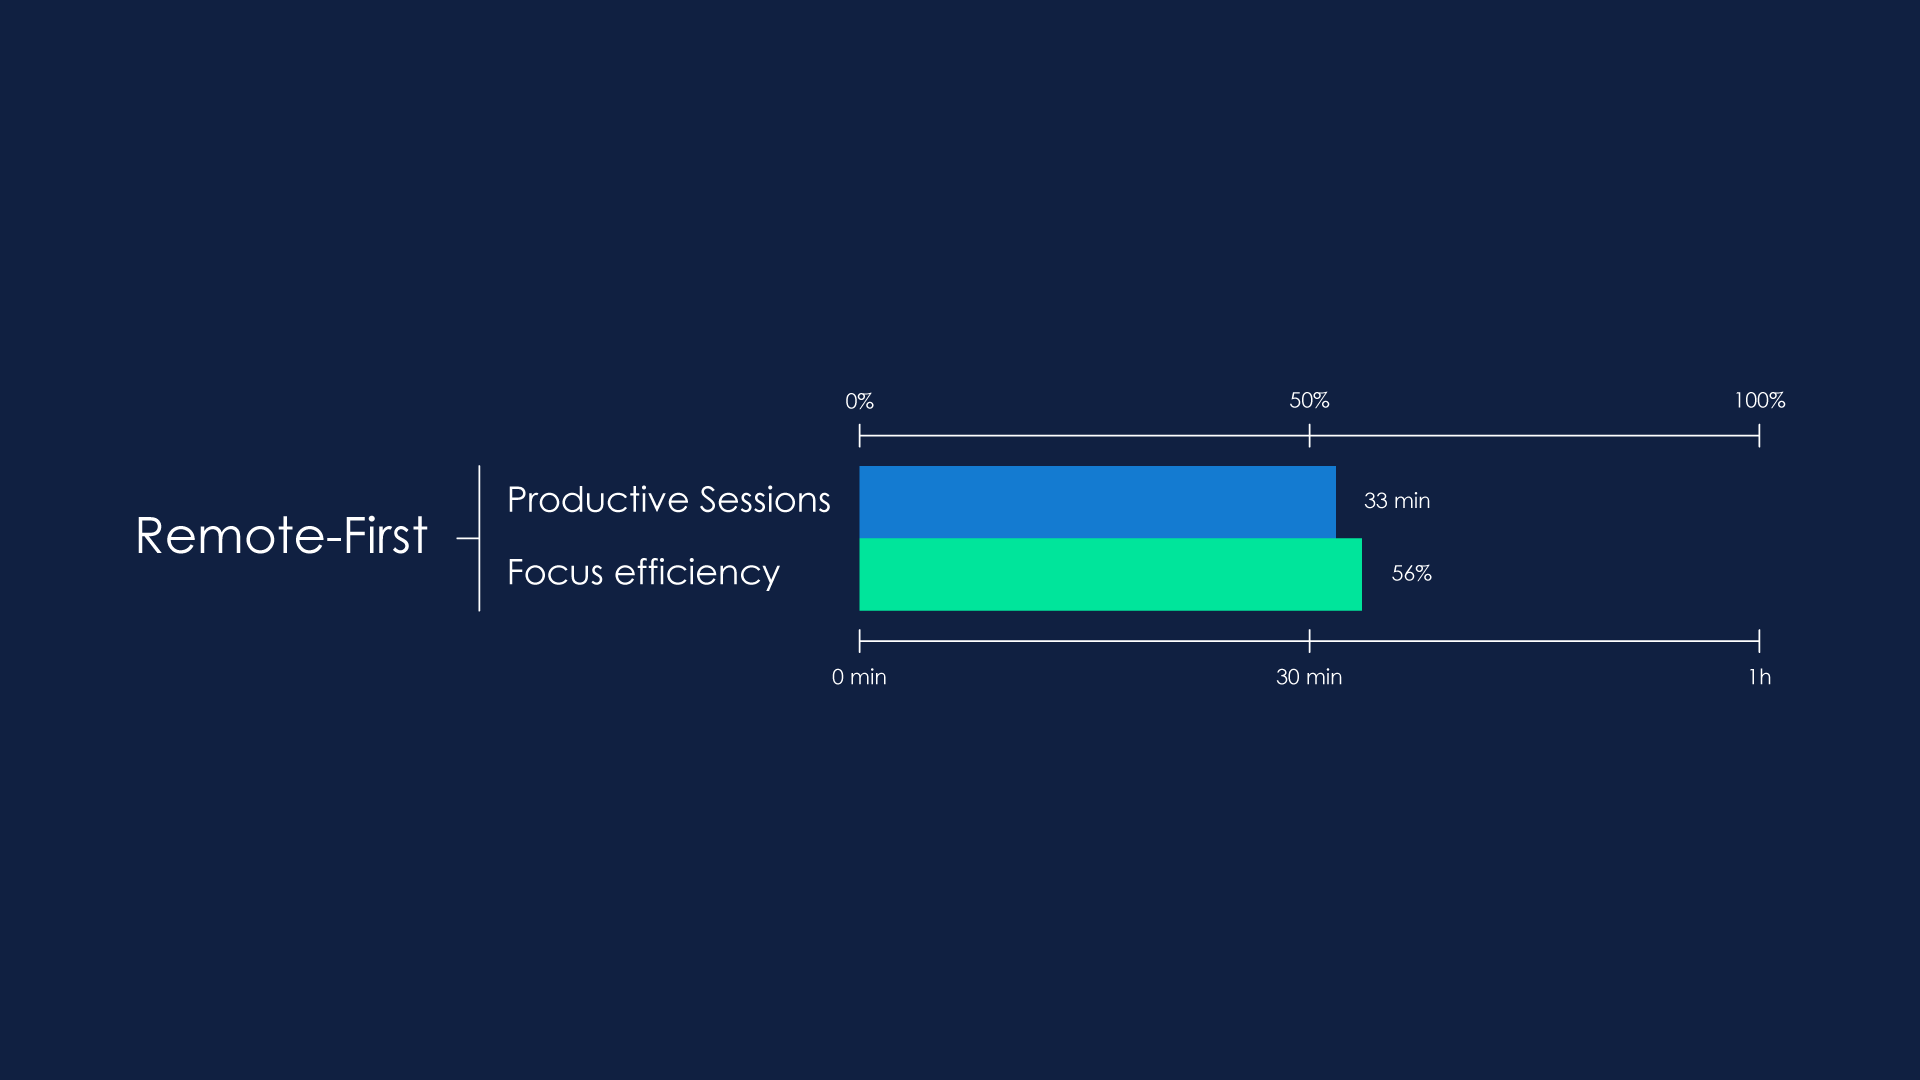
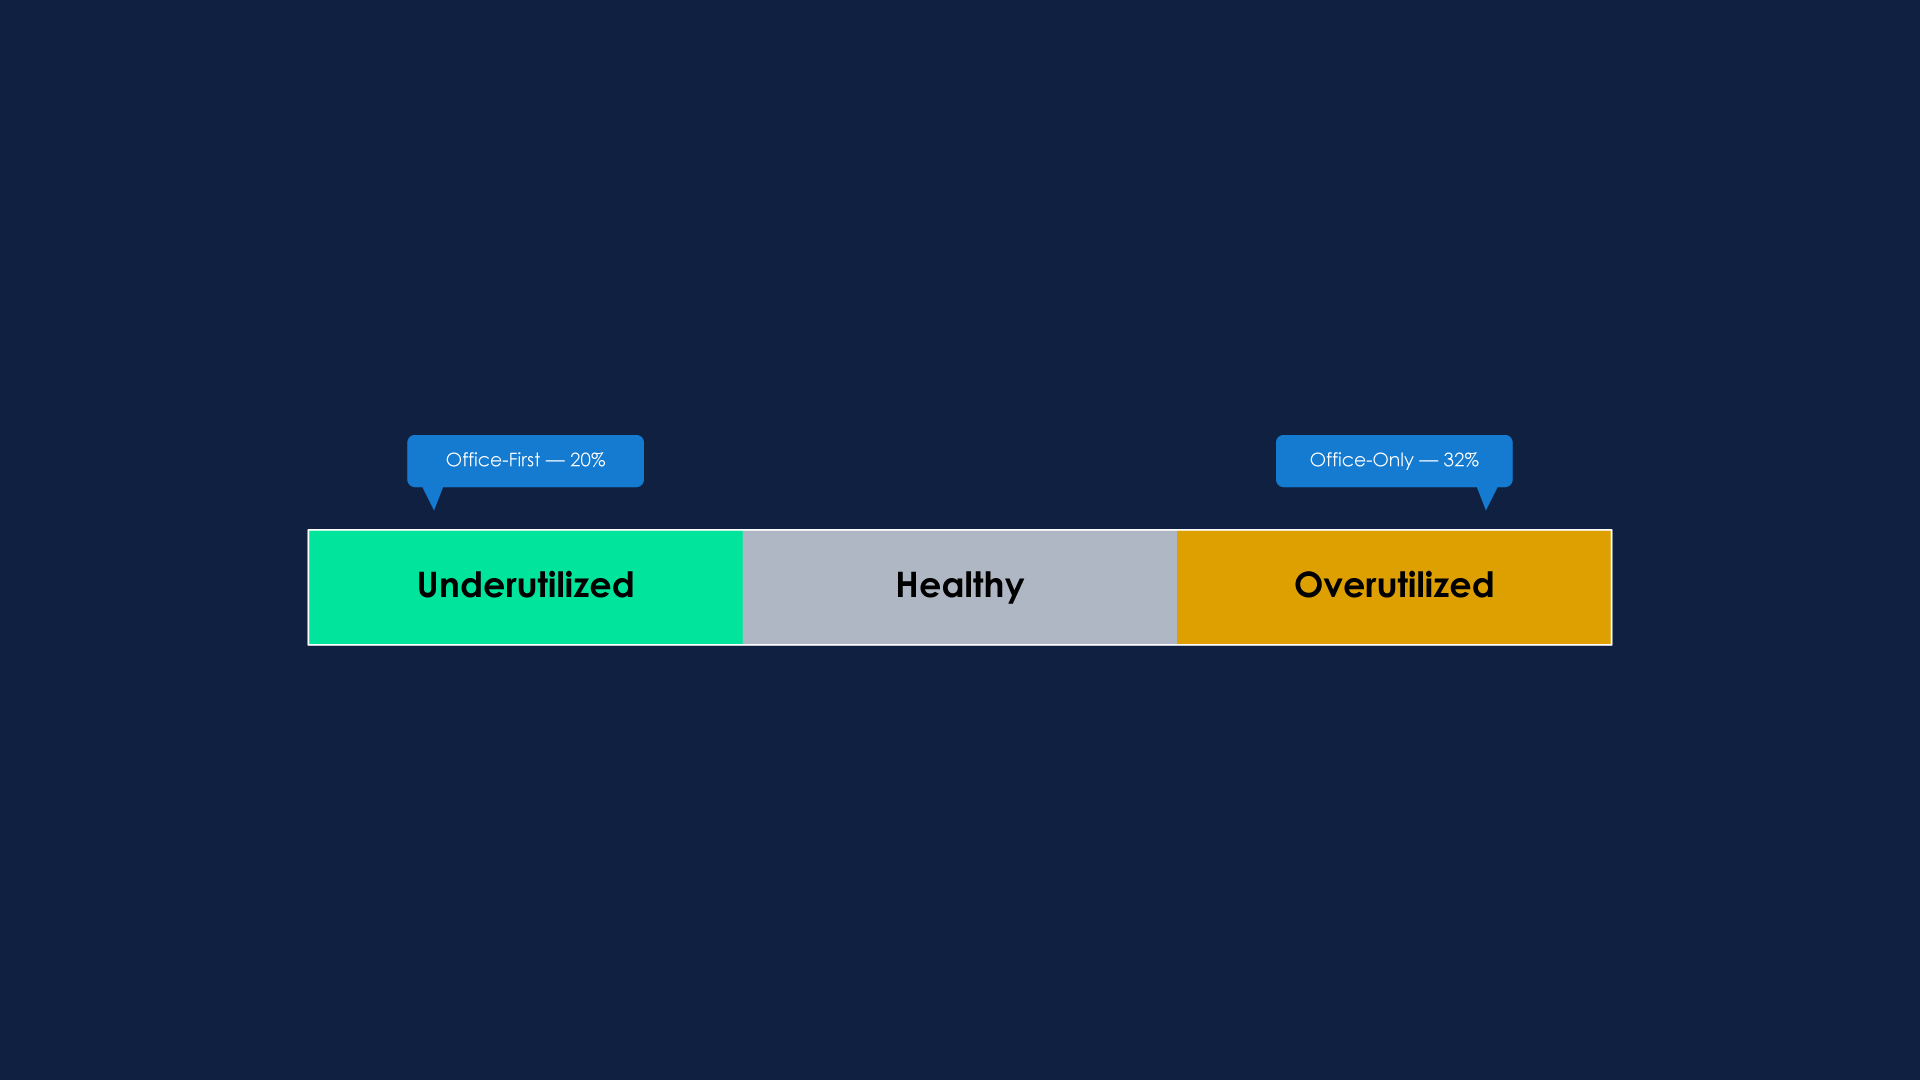
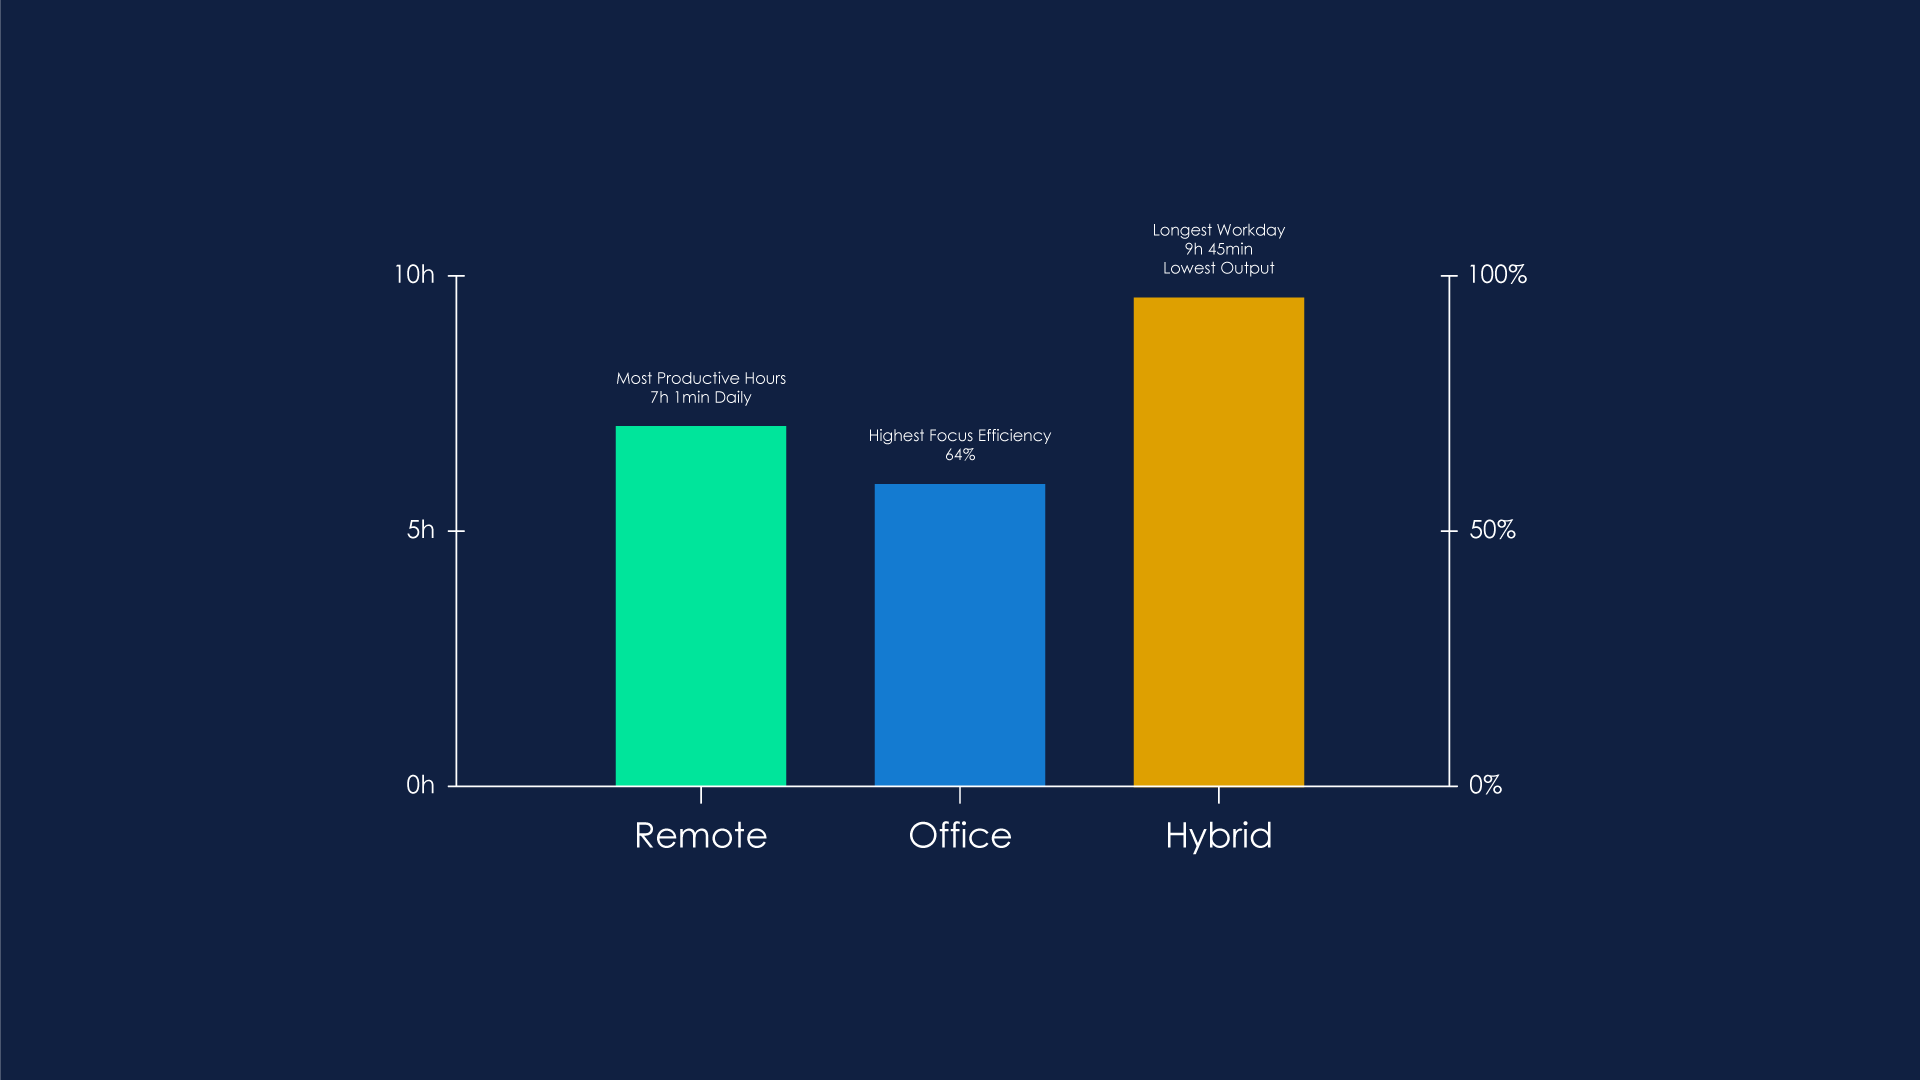
The second is a remote-vs-office data story: a series of bold dark-mode infographics — bar charts, comparison cards, and utilization scales — built to animate sequentially through the findings of a workday study.
These are just two from a longer list. Every project ships as layered files, organized scene by scene, so the editor can focus on timing and motion instead of redrawing what's already on the page.
Gallery


Next project
Sturm